Bonjour tout le monde.
On m'a demandé de faire un petit topo sur le Vix. Un indicateur que tout le monde connait, sans véritablement le connaitre. Ce qui est mon cas. Voici donc ce qu'en dit wiki.
Le VIX est un indicateur de volatilité du marché financier américain. Cet indice est calculé en faisant la moyenne des volatilités sur les options d'achat (call) et les options de vente (put) sur l'indice Standard & Poor's 500, ça tout le monde comprend je pense.
Là, ça devient plus compliqué à comprendre: The VIX is quoted in percentage points and translates, roughly, to the expected movement in the S&P 500 index over the next 30-day period, which is then annualized. For example, if the VIX is 15, this represents an expected annualized change of 15% over the next 30 days; thus one can infer that the index option markets expect the S&P 500 to move up or down 15%/√12 = 4.33% over the next 30-day period. That is, index options are priced with the assumption of a 68% likelihood (one standard deviation) that the magnitude of the change in the S&P 500 in 30-days will be less than 4.33% (up or down).
Et là, je me rends compte que j'ai fait l'impasse sur les maths au lycée.
Mais comme des images valent mieux que des mots:
Ca, c'est le SP500 sur 5 ans.
Pièce jointe:
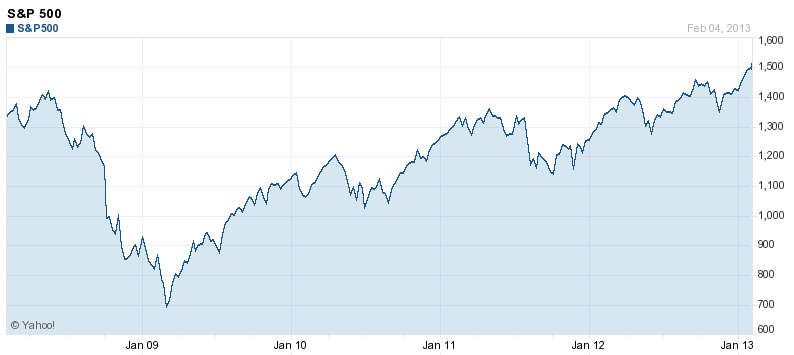 sp500.png [ 18.06 Kio | Consulté 1055 fois ]
Ca, c'est le Vix sur 5 ans.
Pièce jointe:
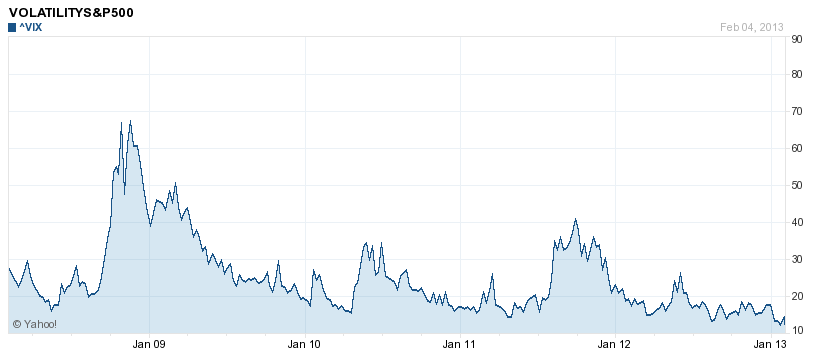 vix.png [ 18.95 Kio | Consulté 1060 fois ]
Et ça, c'est le SP500 sur 5 ans, mais j'ai inversé le tableau... Belle ressemblance avec le Vix, non ?
Pièce jointe:
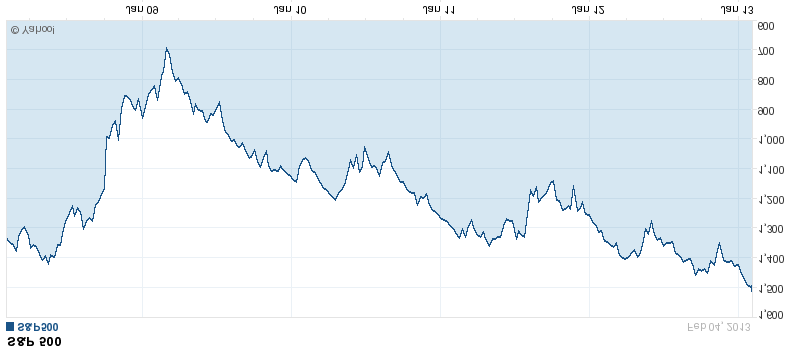 sp500 inversé.png [ 15.56 Kio | Consulté 1067 fois ]
On comprend mieux pourquoi le Vix est à surveillé de près.


 .*.
.*.

 .*.
.*.